Math's Strand
Today in Miss Goslin’s homeroom we did statistics in strand maths . What statistics is, is explaining information you have gathered through a graph. We learn what different types of graph there are bar graphs, pie charts, ETC. First we all got together on the mat And Miss Goslin explained what statistics is. Next we figured out how many siblings everyone had and put them into tally marks. Then she handed out sheets with a couple tasks on and there were a small group to make a bar graph about how many siblings we had. Once everyone was finished we all came together on the mat and Miss Goslin showed us what each part of a bar graph was called.

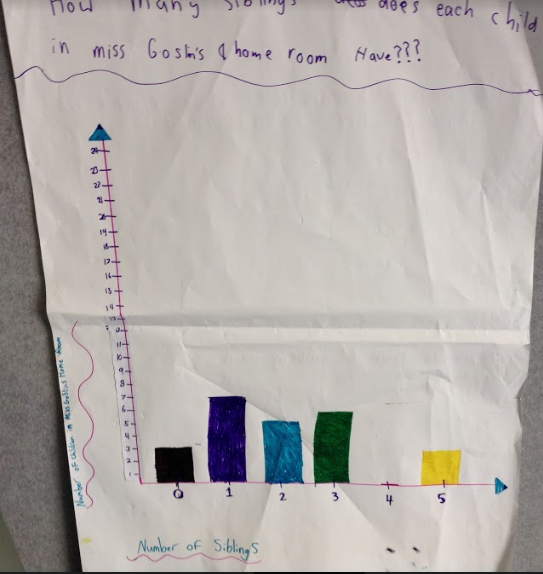
This is a good looking bar graph with both axis labelled and a clear title for your graph. I like the way you have made the increments on both axis even.
ReplyDeleteI wonder if you could pose some questions for others in your space to answer about the graph.